The Brain Activity Flow ("Actflow") Toolbox
Version 0.3.1
Overview
This toolbox facilitates linking brain connectivity with task-evoked activity and associated cognitive/behavioral functions. The primary focus is on activity flow modeling and related methods (Cole et al. (2016) & Ito et al. (2022)).
Activity flow modeling is based on core principles underlying neural network modeling, applying these principles to empirical neural/neuroimaging data. The core theoretical construct is that of activity flow — the movement of activity between neural populations. Activity flow modeling is a highly flexible framework that is constantly being improved via better connectivity methods and creative uses of the approach to better understand brain function.
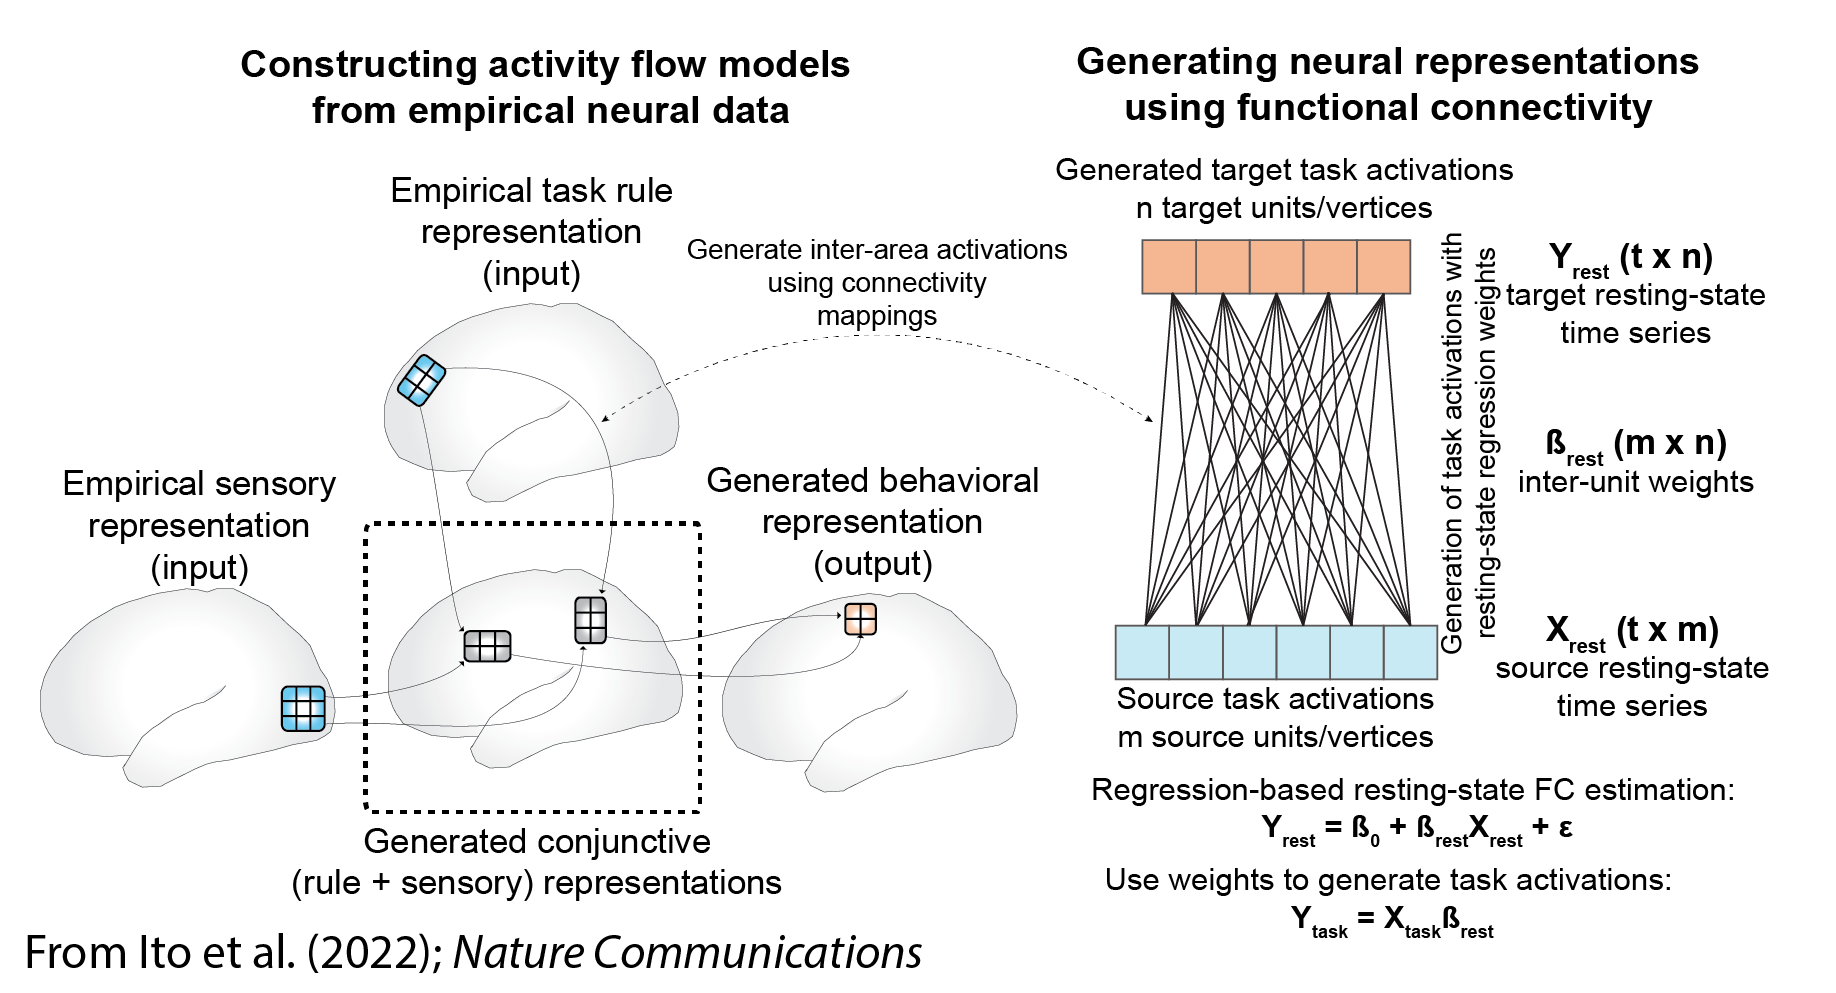
Activity flow modeling can be used, for instance, to infer whether one or more brain connections are involved in producing a particular function. This method can also be used to relate multiple task-evoked activations to each other (e.g., predicting one neural population's activity from another's activity). More generally, activity flow modeling can be thought of as creating network coding models (Ito et al. (2020)), which are empirically-constrained neural network models.
Other methods included in the toolbox (which can optionally be used along with activity flow modeling) are advanced versions of resting-state functional connectivity and task-state functional connectivity. The primary focus (for now) is on fMRI data, but in principle these approaches can be applied to any kind of neural data.
This code repository was created by the Cole Neurocognition Lab at Rutgers University: http://www.colelab.org/
We are happy for others to contribute to the code as well.
See the example notebook to see the Actflow Toolbox in action
We provide 30 subjects' data from the Human Connectome Project for trying out the toolbox.
For a more complete tutorial walkthrough of the toolbox see Cocuzza et al. (2022) STAR Protocols
Core algorithm and principles behind activity flow modeling
Activity flow modeling is a method validated and published in Nature Neuroscience in 2016 (see Cole et al. (2016)), with 14+ follow-up studies further validating the approach.
Activity flow modeling has two basic steps:
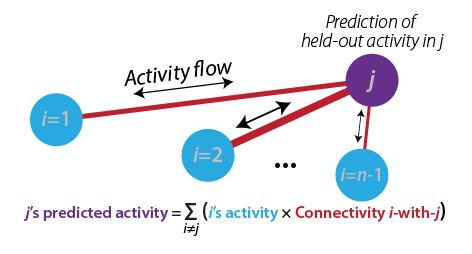
1) Activity flow modeling: Simulating the flow (movement) of activity between neural populations, using empirical data to estimate activity levels and routes of flow (connectivity). This is done by running the standard "propagation rule" and "activation rule" steps used in most neural network simulations (see Ito et al. (2020)). In the standard approach each neural population's activity level is predicted based on the flow from every other recorded neural population (from Cole et al. (2016)):
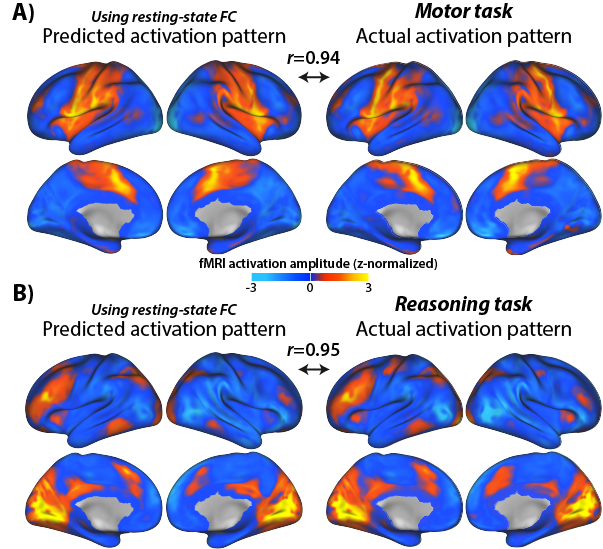
2) Testing prediction accuracy: The predicted brain activity pattern is compared to the actual recorded activity, providing evidence for or against the activity flow model used to make the predictions. Predictions of multiple models can be compared to quantify model validity. Two examples of predicted-to-actual accuracy testing with fMRI data (from Cole et al. (2016)):
In principle, any measure of neural activity and any measure of neural connectivity (e.g., structural connectivity) can be used with activity flow modeling. Some modifications are necessary for fast temporal resolution data such as EEG/MEG or multi-unit recording, but these should be available soon (we are working on it!).
More background info on activity flow modeling can be found on an FAQ about the Cole et al. (2016) paper
Included connectivity modeling methods
- All methods can be applied to resting-state or task-state data
- Correlation-based functional connectivity
- Multiple-regression functional connectivity
- Ordinary least squares multiple regression connectivity
- Regularized multiple regression connectivity
- Principal component regression (PCR) connectivity
- Partial correlation functional connectivity
- Inverse covariance-based partial correlation
- Regularized partial correlation
- Causal connectivity
- CombinedFC (see Sanchez-Romero R, Cole MW (2021). "Combining multiple functional connectivity methods to improve causal inferences". Journal of Cognitive Neuroscience. 33(2):180–194. doi:10.1162/jocn_a_01580)
- Bayes' net methods, such as fGES and PC (Peter-Clark) algorithm; https://doi.org/10.1007/s41060-016-0032-z) [planned]
Preprocessing
- The toolbox is compatible with existing preprocessing software such as the HCP Pipelines (https://humanconnectome.org/software/hcp-mr-pipelines/) or fMRIPrep (https://fmriprep.readthedocs.io/en/stable/)
- Task functional connectivity:
- Finite impulse response (FIR) regressed task data is recommended, which provides flexible mean task-evoked response removal for task-state functional connectivity (Cole et al. (2019)). See Task FC Mean Activity Removal for task-state functional connectivity estimation.
- We recommend empirically validated nusiance regression approaches for removing fMRI data artifacts, such as for resting-state functional connectivity (or task-state functional connectivity)
- Example: The Ciric et al. (2017) validated preprocessing pipelines (https://www.sciencedirect.com/science/article/pii/S1053811917302288)
Cite as:
- Cole MW, Ito T, Bassett DS, Schultz DH (2016). "Activity flow over resting-state networks shapes cognitive task activations". Nature Neuroscience. 19:1718–1726. doi.org/10.1038/nn.4406
- https://colelab.github.io/ActflowToolbox/ and
- The article that describes the specific toolbox functions being used in most detail
How to install
Option 1:
Within an Anaconda environment: conda install -c conda-forge actflow
Option 2:
pip install actflow
Option 3:
git clone --recurse-submodules git@github.com:ColeLab/ActflowToolbox.git
Email list/forum
We strongly encourage you to join the ColeNeuroLab Users Group (https://groups.google.com/forum/#!forum/coleneurolab_users), so you can be informed about major updates in this repository and others hosted by the Cole Neurocognition Lab.
Conventions
- Data matrices all node X time
- Directed connectivity matrices all target X source
- Primary (default) brain parcellation: CAB-NP (https://github.com/ColeLab/ColeAnticevicNetPartition), which uses the Glasser2016 parcellation for cortex (https://balsa.wustl.edu/study/show/RVVG) and includes an additional 358 subcortical parcels. Cortex-only analyses with only the Glasser2016 parcels are easily implemented. Other parcellations can be used, and we anticipate integrating other parcellations in the future.
Examples
A Jupyter Notebook with example analyses (and example data) is viewable here: HCP_example.ipynb
Example of calculating activity flow mapping predictions using multiple-regression FC and standard task-evoked activations with fMRI data (in Python 3; assumes task activations and resting-state fMRI data are already loaded):
import ActflowToolbox as actflow
import numpy as np
import matplotlib.pyplot as plt
import seaborn as sns

restFC_mreg=np.zeros((np.shape(restdata)[0],np.shape(restdata)[0],np.shape(restdata)[2]))
for scount in np.arange(np.shape(restdata)[2]):
    restFC_mreg[:,:,scount]=actflow.connectivity_estimation.multregconn(restdata[:,:,scount])

print("==Activity flow mapping results, multiple-regression-based resting-state FC, 24 task conditions==")
actflowOutput_restFCMReg_bycond = actflow.actflowcomp.actflowtest(activations_bycond, restFC_mreg)
Output:
==Activity flow modeling results, multiple-regression-based resting-state FC, 24 task conditions==
===Comparing prediction accuracies between models (similarity between predicted and actual brain activation patterns)===

==Comparisons between predicted and actual activation patterns, across all conditions and nodes:==
--Compare-then-average (calculating prediction accuracies before cross-subject averaging):
Each comparison based on 24 conditions across 360 nodes, p-values based on 30 subjects (cross-subject variance in comparisons)

Mean Pearson r = 0.78, t-value vs. 0: 62.27, p-value vs. 0: 1.9635597302245892e-32

Mean % variance explained (R^2 score, coeff. of determination) = 0.57

Mean MAE (mean absolute error) = 7.54

Note: Pearson r and Pearson r^2 are scale-invariant, while R^2 and MAE are not. R^2 units: percentage of the to-be-predicted data's unscaled variance, ranging from negative infinity (because prediction errors can be arbitrarily large) to positive 1. See https://scikit-learn.org/stable/modules/generated/sklearn.metrics.r2_score.html for more info.
Visualizing the results:
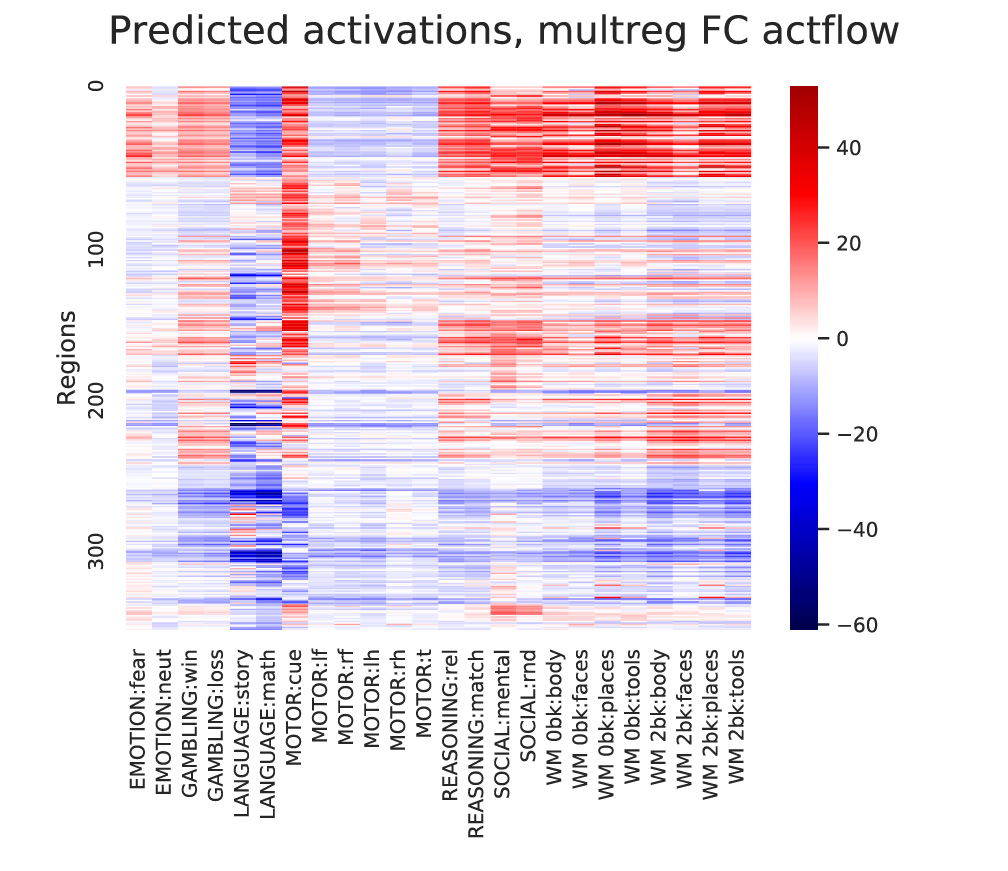
#Visualize predicted and actual activation patterns, with multiple-regression FC
plt.figure(figsize=[7,5])
ax = sns.heatmap(np.mean(actflowOutput_restFCMReg_bycond['actPredVector_bytask_bysubj'],axis=2)[netorder,:],center=0,cmap='seismic',cbar=True,yticklabels=100,xticklabels=taskConditions)
ax.figure.suptitle('Predicted activations, multreg FC actflow')
ax.set(ylabel='Regions')
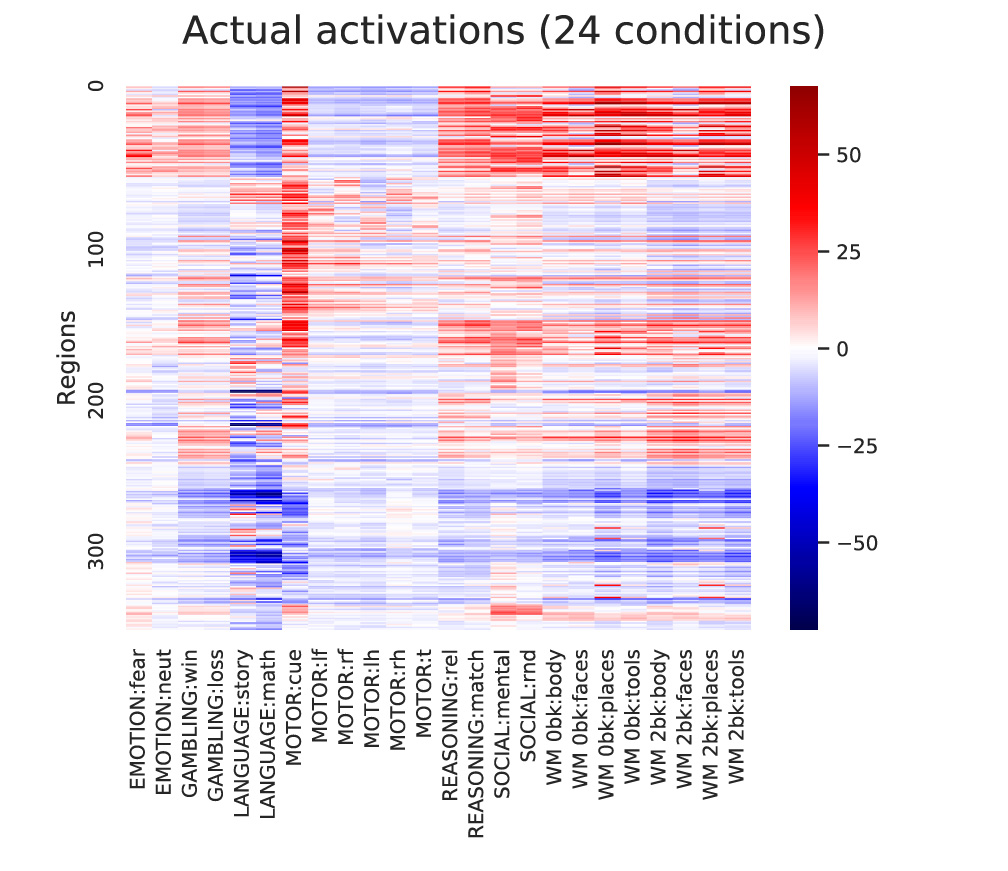
plt.figure(figsize=[7,5])
ax = sns.heatmap(np.mean(activations_bycond,axis=2)[netorder,:],center=0,cmap='seismic',cbar=True,yticklabels=100,xticklabels=taskConditions)
ax.figure.suptitle('Actual activations (24 conditions)')
ax.set(ylabel='Regions')
Output:
General guidelines for activity flow modeling
- Avoid circularity:
- Use connectivity independent of the to-be-predicted state when possible, such as resting-state functional connectivity. This implicitly tests for generalization across brain states (when predicting task activations), which is important given that connectivity is mostly invariant across states. There is substantial evidence for the dominant effect of intrinsic/state-general connectivity (see Cole et al. (2014) and Gratton et al. (2018)). Using structural connectivity also avoids this issue, though some details (e.g., the aggregate effects of synaptic weights) are lost with most structural connectivity methods.
- Ensure statistical independence of activation and functional connectivity estimates when the same state is used for estimating both. The recommended approach is to use finite impulse response (FIR) regression as a preprocessing step, removing the to-be-predicted mean task activations prior to estimating task-state functional connectivity. Note that this leaves most of the task-related variance in the time series, since mean task effects are only a small (but important; which is why we try to predict them via activity flow modeling) portion of the data. See Cole et al. (2019) for more info.
- Spatial smoothness of the data can introduce circularity, since this results in the same underlying neural activity being assigned to multiple spatial locations (such as multiple voxels in fMRI). We therefore recommend excluding activity flow source data within approximately 10 mm from the to-be-predicted neural signal with fMRI data (see Cole et al. (2016)). This is less of a concern with brain region level data, since it would only apply to voxels/vertices at the border of each region. We nonetheless implemented a "non-circular" version of region-level activity analysis (excluding regions within 10 mm of the to-be-predicted region), which is demonstrated in the example notebook. The vast majority of results do not change with vs. without the "non-circular" region-level approach. Note that standard activity flow modeling should not be used with EEG/MEG or related methods, since the source spread implicit in those approaches is so substantial (even when using source localization) that it would result in substantial circularity. However, see Mill et al. (2022) for a version of activity flow modeling that can be used with EEG/MEG (or other high-temporal-resolution methods).
- Compare-then-average vs. average-then-compare:
- We recommend compare-then-average statistics for most analyses (the default option in the actflowtest function). Compare-then-average compares each subject's predicted to actual activity prior to aggregating results across subjects, such that the group-level estimate is representative of individual subject results (i.e., what would be expected if the analysis was run with a new random subject). In contrast, the average-then-compare approach averages results across subjects prior to comparing predicted to actual activity. This typically boosts predicted-to-actual similarity due to more data being included in both the predicted and actual estimates, as well as due to "bluring"/smoothing the data from cross-subject averaging. It also prevents computation of meaningful p-values, since there is no inter-subject variance in prediction accuracy to use for t-tests and similar approaches. Note, however, that visualizing group results (plotting predicted and actual activation patterns next to each other) effectively results in the average-then-compare approach, since results are averaged prior to the reader comparing the results by eye. Thus, predicted-to-actual similarity typically appears higher in these plots than they are at the individual subject level.
Software development guidelines
- Primary language: Python 3
- Secondary language (for select functions, minimally maintained/updated): MATLAB
- Versioning guidelines: Semantic Versioning 2.0.0 (https://semver.org/); used loosely prior to v1.0.0, strictly after
- Using GitHub for version control
- Those new to Git should go through a tutorial for branching, etc.: https://www.youtube.com/watch?v=oFYyTZwMyAg and https://guides.github.com/activities/hello-world/
- Use branching for adding new features, making sure code isn't broken by changes
- Considering using unit tests and Travis CI (https://travis-ci.org) in future
- Style specifications:
- PEP8 style as general guidelines (loosely applied for now): https://www.python.org/dev/peps/pep-0008/
- Soft tabs (4 spaces) for indentations [ideally set "soft tabs" setting in editor, so pressing tab key produces 4 spaces]
- Use intuitive variable and function names
- Add detailed comments to explain what code does (especially when not obvious)
Publications that have used activity flow modeling and/or this toolbox
Using resting-state fMRI
- Cole MW, Ito T, Bassett DS, Schultz DH (2016). "Activity flow over resting-state networks shapes cognitive task activations". Nature Neuroscience. 19:1718–1726. http://dx.doi.org/10.1038/nn.4406
- Ito T, Kulkarni KR, Schultz DH, Mill RD, Chen RH, Solomyak LI, Cole MW (2017). "Cognitive task information is transferred between brain regions via resting-state network topology". Nature Communications. 8:1027. http://dx.doi.org/10.1038/s41467-017-01000-w
- Mill RD, Gordon BA, Balota DA, Cole MW (In Press). "Predicting dysfunctional age-related task activations from resting-state network alterations". NeuroImage. doi:10.1016/j.neuroimage.2020.117167
- Ito T, Hearne LJ, Cole MW (In Press). "A cortical hierarchy of localized and distributed processes revealed via dissociation of task activations, connectivity changes, and intrinsic timescales". NeuroImage. doi:10.1016/j.neuroimage.2020.117141
- Ito T, Yang GB, Laurent P, Schultz DH, Cole MW (2022). "Constructing neural network models from brain data reveals representational transformation linked to adaptive behavior". Nature Communications. 13, 673. doi:10.1038/s41467-022-28323-7
- Sanchez-Romero R, Ito T, Mill RD, Hanson SJ, Cole MW (2023). "Causally informed activity flow models provide mechanistic insight into network-generated cognitive activations". NeuroImage. 278:120300. doi:10.1016/j.neuroimage.2023.120300
- Cocuzza CV, Sanchez-Romero R, Ito T, Mill RD, Keane BP, Cole MW (Preprint). "Distributed network flows generate localized category selectivity in human visual cortex". bioRxiv. doi:10.1101/2022.02.19.481103
- Peterson KL, Sanchez-Romero R, Mill RD, Cole MW (Preprint). "Regularized partial correlation provides reliable functional connectivity estimates while correcting for widespread confounding". bioRxiv. doi:10.1101/2023.06.27.546751)
Using task-state fMRI (often in addition to resting-state fMRI)
- Cole MW, Ito T, Cocuzza C, Sanchez-Romero R (2021). "The functional relevance of task-state functional connectivity". Journal of Neuroscience. 41(12):2684-2702. doi:10.1523/JNEUROSCI.1713-20.2021
- Hearne LJ, Mill RD, Keane BP, Repovs G, Anticevic A, Cole MW (2021). "Activity flow underlying abnormalities in brain activations and cognition in schizophrenia". Science Advances. 7(9) doi:10.1126/sciadv.abf2513
Using structural connectivity (diffusion MRI)
- Yan, Tianyi, Tiantian Liu, Jing Ai, Zhongyan Shi, Jian Zhang, Guangying Pei, and Jinglong Wu. 2021. “Task-Induced Activation Transmitted by Structural Connectivity Is Associated with Behavioral Performance.” Brain Structure & Function, March. https://doi.org/10.1007/s00429-021-02249-0.
Using electroencephalography (EEG) or magnetoencephalography (MEG)
- Mill RD, Hamilton JL, Winfield EC, Lalta N, Chen RH, Cole MW (2022). "Network modeling of dynamic brain interactions predicts emergence of neural information that supports human cognitive behavior". PLOS Biology. doi:10.1101/2021.01.26.428276
Other related tools
- Information transfer mapping
- Task FC Mean Activity Removal for task-state functional connectivity estimation
- The Cole-Anticevic Brain-wide Network Partition (CAB-NP)
- Other tools released by the Cole Neurocognition Lab